Measuring Validity for Moving Average Forecasts
| Introduction.
Again we are going to work at developing
more objective measures for the quality of a forecast. We are again
going to focus on APE = Average Percentage Error.
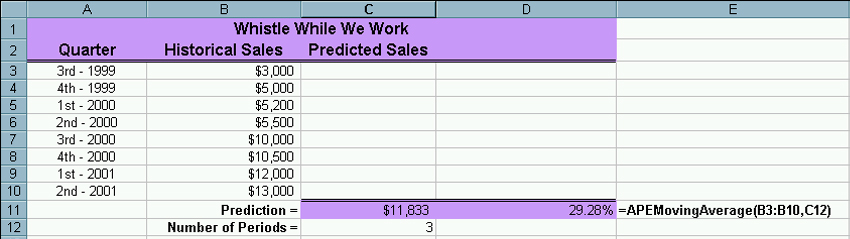
Due to some previous familiarity I will start by showing the spreadsheet
computations for APE for the two-period and three-period moving average
forecasts we did on the Whistle While We Work data.
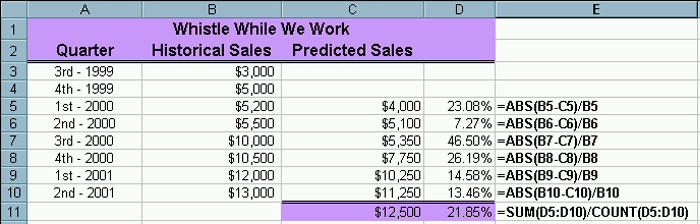
The spreadsheet for the two-period moving average is below. |
| Notice that the average error is about 21.85%, which is
up from many of the error estimates we got for exponential
smoothing. Though none of these approaches is giving a very good
forecast.
The spreadsheet for the three-period moving average forecast is next. |
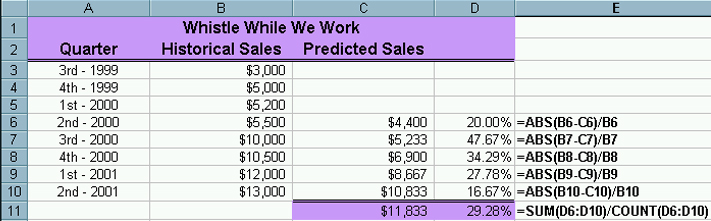
| Notice that this error is actually worse than that for
the two-period. This shouldn't be too surprising because the major
thing going on in this data is a trend and we have yet to study any
forecasting methods that work well for trends!
But we need to arrive at some general statements about computing our error terms and computing their averages.
there will be
These all influence the nature of our loops when we compute past predictions and errors. The code for computing the APEMovingAverage function follows. Function APEMovingAverage(Historical, NumberOfPeriods) As Single
' Accumulating the appropriate number of most recent previously observed values
Next PredictionCounter
Next ErrorCounter The code will be discussed in class. You want to check this function on your spreadsheet against other things we've developed. Make sure you choose the number of periods in the moving average the same for both the prediction and the error computation. For the WWWW three period moving average the spreadsheet follows. |