Moving Average Forecasting
| Introduction.
As you might guess we are looking at some of the most primitive
approaches to forecasting. But hopefully these are at least a
worthwhile introduction to some of the computing issues related to
implementing forecasts in spreadsheets.
In this vein we will continue by starting at the beginning and start working with Moving Average forecasts. Moving Average Forecasts. Everyone is familiar with moving average forecasts regardless of whether they believe they are. All college students do them all the time. Think about your test scores in a course where you are going to have four tests during the semester. Let's assume you got an 85 on your first test.
Regardless of all the blabbing you might do to your friends and parents, they and your teacher are very likely to expect you to get something in the area of the 85 you just got. Well, now let's assume that in spite of your self-promotion to your friends, you over-estimate yourself and figure you can study less for the second test and so you get a 73. Now what are all of the concerned and unconcerned going to anticipate you will get on your third test? There are two very likely approaches for them to develop an estimate regardless of whether they will share it with you.
Both of these estimates are actually moving average forecasts.
Let's assume that all these people busting on your great mind have sort of pissed you off and you decide to do well on the third test for your own reasons and to put a higher score in front of your "allies". You take the test and your score is actually an 89! Everyone, including yourself, is impressed. So now you have the final test of the semester coming up and as usual you feel the need to goad everyone into making their predictions about how you'll do on the last test. Well, hopefully you see the pattern.
|
| Periods in
Moving Average Forecast |
Forecast Calculation | Forecast |
| 1 | 89 | 89 |
| 2 | (73 + 89)/2 | 81 |
| 3 | (85 + 73 + 89)/3 | 82.33 |
| Now, hopefully you can see the pattern. Which do
you believe is the most accurate?
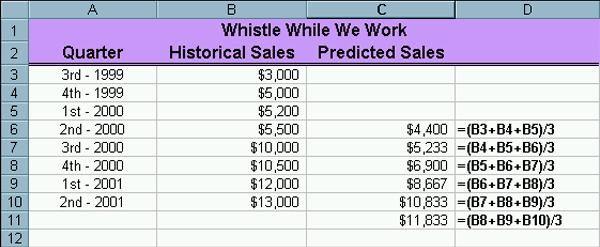
Whistle While We Work. Now we return to our new cleaning company started by your estranged half sister called Whistle While We Work. You have some past sales data represented by the following section from a spreadsheet. We first present the data for a three period moving average forecast. |
| The entry for cell C6 should be
=(B3 + B4 + B5)/3 Now you can copy this cell formula down to the other cells C7 through C11. Notice how the average moves over the most recent historical data but uses exactly the three most recent periods available for each prediction. You should also notice that we don't really need to make the predictions for the past periods in order to develop our most recent prediction. This is definitely different from the exponential smoothing model. I've included the "past predictions" because we will use them in the next web page to measure prediction validity. Now I want to present the analogous results for a two period moving average forecast. |
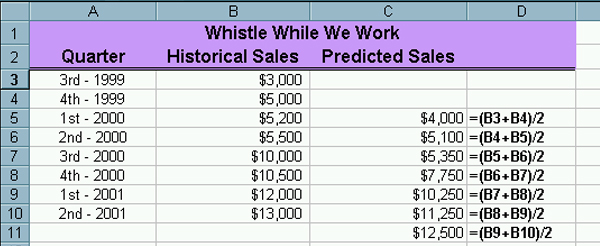
| The entry for cell C5 should be
=(B3 + B4)/2 Now you can copy this cell formula down to the other cells C6 through C11. Notice how now only the two most recent pieces of historical data are used for each prediction. Again I have included the "past predictions" for illustrative purposes and for later use in forecast validation. Some other things that are of importance to notice.
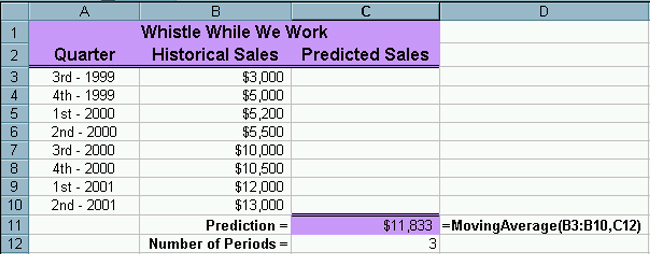
Both of these issues will be very significant when we develop our code. Developing the Moving Average Function. Now we need to develop the code for the moving average forecast that can be used more flexibly. The code follows. Notice that the inputs are for the number of periods you want to use in the forecast and the array of historical values. You can store it in whatever workbook you want. Function MovingAverage(Historical, NumberOfPeriods) As Single
Next Counter The code will be explained in class. You want to position the function on the spreadsheet so that the result of the computation appears where it should like the following. |
| Now we need to develop the code for the prediction validity in the next web page. |