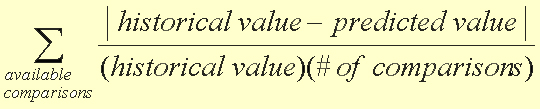
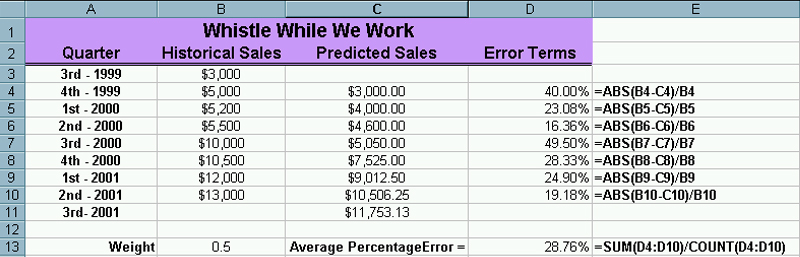
| The formula for cell C13 where you take the average of
the percentage errors is
=SUM(D4:D10)/COUNT(D4:D10)
Notice that are percentage errors for each prediction
are quite bad. At this point, all I can say is hopefully we will
do better. We need to take the absolute value of each difference
to make sure we average error terms which should all be positive.
Modifying Our Code.
There are a couple ways we can modify our code to calculate these error
terms and determine the average. Since we have all of our entries
in arrays I will do these calculations in a separate code segment,
though I will write out the entire function on this page. Function APEExponentialSmoothing(Weight, Historical) As Single
' Declaring and initializing variables
Dim Counter As Integer
Dim ErrorCounter As Integer
Dim HistoricalSize As Integer
Dim Item As Variant
Dim ErrorTerm As Single
Dim TotalError As Single
Dim Predictions(1 To 100) As Single
' Initializing values
Counter = 1
TotalError = 0#
For Each Item In Historical
If Counter = 1 Then
Predictions(1) = Historical(Counter)
Counter = Counter + 1
Else
Predictions(Counter) = (Weight * Historical(Counter)) + ((1 - Weight) * Predictions(Counter - 1))
Counter = Counter + 1
End If
Next Item
HistoricalSize = Counter - 1
' Calculating the Average Percentage Error
For ErrorCounter = 1 To HistoricalSize - 1
' Doing the calculations by breaking out each term in hopes it makes this clearer
ErrorTerm = Abs(Historical(ErrorCounter + 1) - Predictions(ErrorCounter)) / Historical(ErrorCounter + 1)
TotalError = TotalError + ErrorTerm
Next ErrorCounter
APEExponentialSmoothing = TotalError / (HistoricalSize - 1)
End Function
Notice that we have used a different
function to compute the errors. You should also notice that we had
to recalculate the predictions in order to determine the errors.
This code will be discussed in class. Make sure
you test this code by comparing it to your results for the spreadsheet
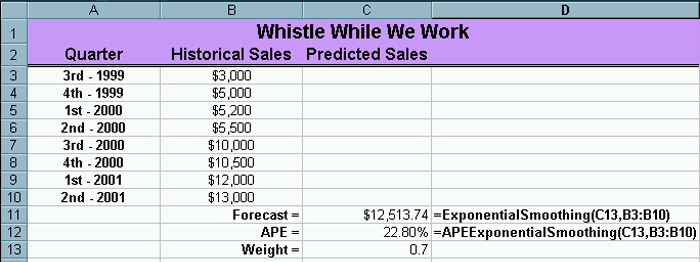
calculations. You are likely to want to develop
your spreadsheet like the following so that it automatically
recalculates both the forecast and the error as you change the weight. |